Bitcoin Price Has Limited Downside, Likely Near Bottom, Contrarian Indicator Suggests
Bitcoin's long-term moving averages are set to flash a bearish signal, which has historically marked bear market bottoms and renewed bull runs. The indicator suggests the bear market has nearly run its course and the bottom is near.
Intelligence analysis by Llama 3.3 70B
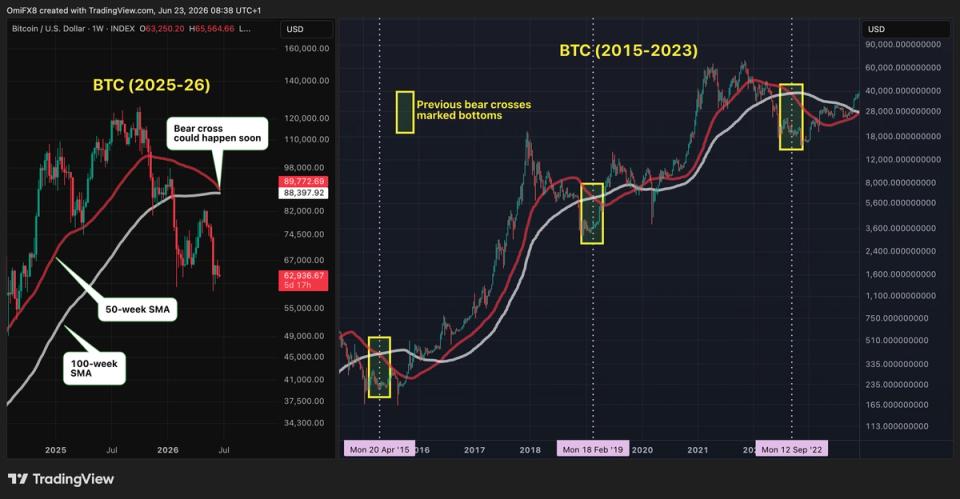
A contrarian indicator based on Bitcoin's 50-week and 100-week simple moving averages is set to flash a bearish signal, which could mark a market bottom and the beginning of a three-year rally.
Imagine you're on a rollercoaster, and it's been going down for a while. This indicator is like a sign that says the rollercoaster is about to start going back up. It's not a guarantee, but it's a good sign that the worst might be over.
Analysis
Understanding the Contrarian Indicator
The contrarian indicator is based on the intersection of Bitcoin's 50-week and 100-week simple moving averages. This signal has historically been a reliable indicator of bear market bottoms and the beginning of new bull runs. The indicator is considered contrarian because it flashes a bearish signal, but has consistently marked the end of a decline and the start of a three-year rally.
Historical Precedent
There have been three instances of this bear cross in Bitcoin's history, and each has marked a market bottom. The first occurred in 2015, the second in 2018, and the third in 2020. In each case, the signal was followed by a significant rally. While past performance is not a guarantee of future results, the consistency of this indicator makes it a significant development for Bitcoin investors and traders.
Implications for the Market
The impending bear cross has significant implications for the Bitcoin market. If the signal is accurate, it could mark the end of the current bear market and the beginning of a new bull run. This could lead to increased investment and trading activity, as well as a rise in Bitcoin's price. However, it is essential to note that the indicator is not foolproof, and other market factors, such as bond yields and ETF flows, could impact Bitcoin's price.
Key points
- The contrarian indicator is based on the intersection of Bitcoin's 50-week and 100-week simple moving averages
- The indicator has historically marked bear market bottoms and the beginning of new bull runs
- The impending bear cross could mark the end of the current bear market and the beginning of a new bull run
If the contrarian indicator is accurate, Bitcoin's price could experience a significant rally, potentially leading to a three-year bull run. This could lead to increased investment and trading activity, as well as a rise in Bitcoin's price. The indicator's historical accuracy and the potential for a bullish outlook make it a significant development for Bitcoin investors and traders.
While the contrarian indicator has been reliable in the past, there is no guarantee that it will be accurate this time. Other market factors, such as bond yields and ETF flows, could impact Bitcoin's price and prevent a rally. Additionally, the indicator's signal could be delayed or false, leading to further declines in Bitcoin's price.