Your Controls Block Known Attacks. What About the Behavior?
A prevention score tells you what a control recognizes, but not what it stops. The Blue Report 2026 from Picus Labs measures how enterprise prevention and detection perform in production, across 338 million attack simulations. The report finds that prevention effectivenes…
Intelligence analysis by Llama
The same controls that block a well-known attack tool let a quieter version of the same technique slip past defenses. The outcome depends on how recognizable the attacker's method is and whether anyone tested for the quiet variant.
Imagine you have a security system that can catch some bad guys, but not all of them. The bad guys who are easy to catch are like the ones who walk in the front door, but the ones who are harder to catch are like the ones who sneak in through the back door. The security system can catch the ones who walk in the front door, but it can't catch the ones who sneak in through the back door.
Analysis
Prevention Scores Are Not Enough
A prevention score tells you what a control recognizes, but not what it stops. The Blue Report 2026 from Picus Labs measures how enterprise prevention and detection perform in production, across 338 million attack simulations. The report finds that prevention effectiveness rose from 62% to 69%, back to its 2024 peak. However, this number is a stack-wide average and masks a softer, more vulnerable interior.
The Same Controls, Different Outcomes
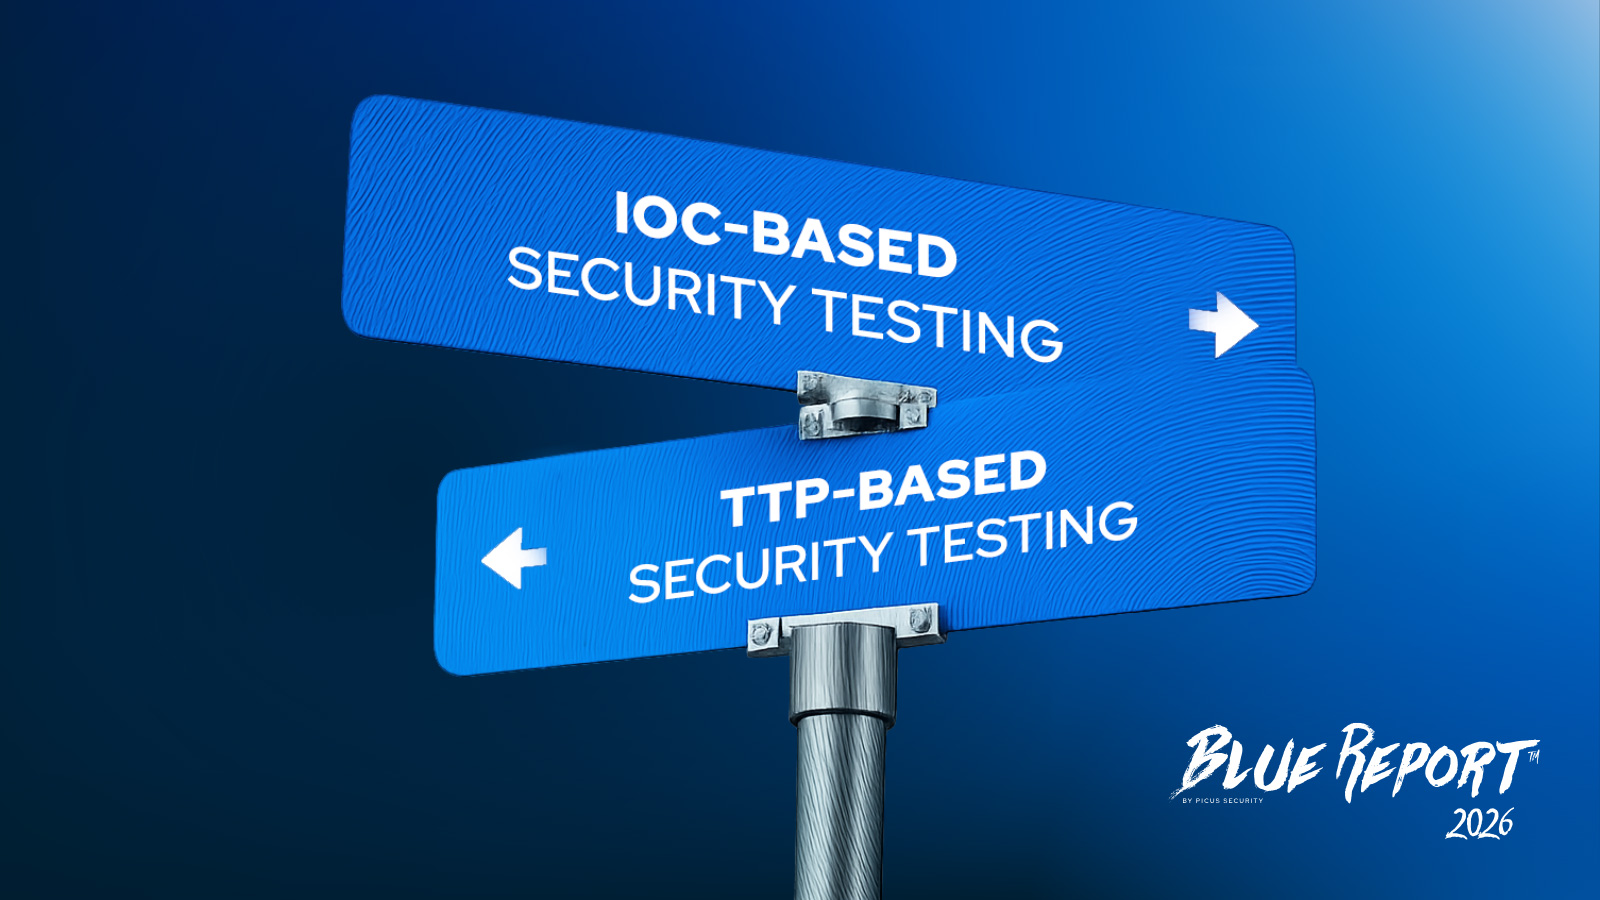
The same controls that block a well-known attack tool let a quieter version of the same technique slip past defenses. The outcome depends on how recognizable the attacker's method is and whether anyone tested for the quiet variant. IOC-based testing asks whether a control recognizes known bad, while behavioral, TTP-based testing asks whether a control stops the action, by any route.
The Asymmetry Between Edge and Interior
The edge is slipping too. In this year's data, the IOC-based prevention rate for malware downloads fell to 50% across customer environments, from 60% last year and 71% in 2024. Even the layer that signatures cover best is giving way. And a passing score here says nothing about the behavior underneath, which is where the Mimikatz result comes in.
Mimikatz: A Behavior, Not a Procedure
Mimikatz is one behavior; the same split runs across the whole interior. The 69% overall Prevention Rate measures how well controls stop attacks at the boundary. Autonomous penetration testing measures something harder: what an attacker can actually accomplish once they're inside as an 'authenticated user.' Across the full set of those post-compromise actions, only 37% were blocked. The perimeter stops two attacks in three; once inside, this falls to barely one in three.
Key points
- Prevention scores do not tell you what a control stops.
- The same controls that block a well-known attack tool let a quieter version of the same technique slip past defenses.
- IOC-based testing asks whether a control recognizes known bad, while behavioral, TTP-based testing asks whether a control stops the action, by any route.
- The edge is slipping too, with the IOC-based prevention rate for malware downloads falling to 50% across customer environments.
- Only 37% of post-compromise actions were blocked, suggesting that organizations are not doing enough to protect themselves.
If organizations can understand the limitations of prevention scores and the importance of behavioral testing, they can improve their defenses and stay ahead of attackers. This can lead to a safer and more secure environment for users.
The fact that prevention effectiveness has dropped to 50% for malware downloads and that only 37% of post-compromise actions were blocked suggests that organizations are not doing enough to protect themselves. This can lead to a higher risk of attacks and data breaches.