5th Worst Bitcoin Price Action Ever — I’m Buying At 99.8% Probability
Bitcoin is under pressure, but the article says several rare indicators are lining up with past major accumulation zones.
Intelligence analysis by GPT-5.4 Mini
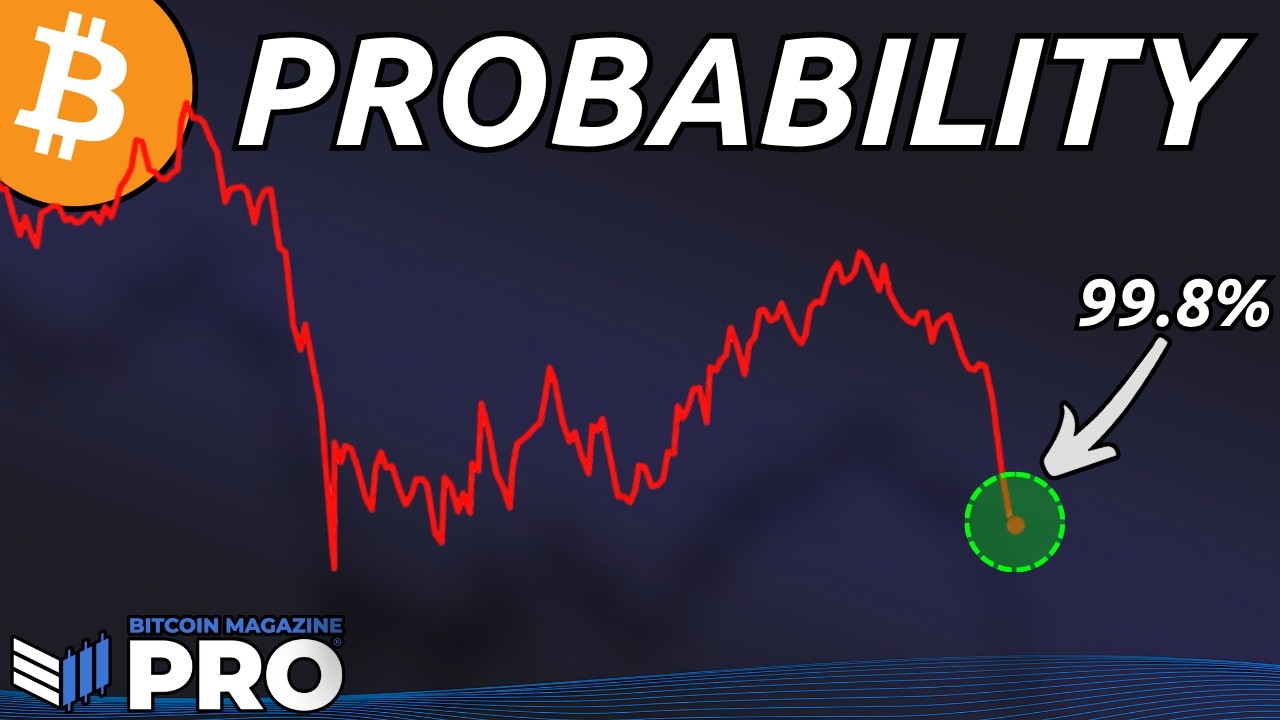
The piece argues that Bitcoin’s selloff looks severe on the surface, but multiple momentum, on-chain, and trend indicators are clustered at historical extremes. The author says that setup has appeared only a handful of times before, and each prior instance marked a strong buying opportunity.
The article says Bitcoin looks beat up, but several big warning lights are flashing at the same time. In the past, that kind of crashy-looking moment was often like finding a toy on sale after a big store markdown.
Analysis
What the article argues
Bitcoin Magazine says the current price action looks weak, but that weakness is creating a setup the author wants to buy. The core claim is that several independent indicators are all flashing historically extreme readings at the same time.
The indicators cited
The article points first to the Crosby Ratio Z-score, which it says is around -1.7 and near one of the lowest readings in Bitcoin’s history. It describes that level as rarer than 99.8% of all daily readings. The examples given for similarly extreme periods are the drop to $60,000, the first break below $20,000 in 2022, the March 2020 COVID crash, and the 2018 bear market low.
It also says weekly RSI is near historical lows, with past comparisons including the 2015 and 2018 bear market lows, the COVID crash, and the recent dip to $60,000. The article treats that as confirmation that momentum is stretched across more than one method of measurement.
On trend structure, the article says Bitcoin has bounced off the 200-week moving average, which it describes as a reliable bear-market support level over Bitcoin’s history, aside from the FTX-driven overshoot in late 2022. It adds that the recent cycle low sits below current prices, creating the outline of a possible double bottom.
On-chain and valuation context
The piece says SOPR is in the bottom fifth percentile of its historical range, meaning realized losses are unusually deep. It also says value days destroyed suggests long-term holders have not meaningfully joined the selling, implying the pressure has been driven more by short-term traders and leveraged positions. The Mayer Multiple is also described as sitting in its bottom fifth percentile. The author’s conclusion is that when these kinds of extremes have lined up before, Bitcoin has often offered strong accumulation opportunities.
Key points
- The article says Bitcoin is in a rare historical setup based on several indicators lining up at once.
- The Crosby Ratio Z-score is described as near its lowest reading in Bitcoin history.
- Weekly RSI, SOPR, and the Mayer Multiple are all said to be in extreme historical zones.
- The 200-week moving average is presented as a key support level that Bitcoin has bounced from again.
- The author argues the selloff has mostly hit short-term traders and leveraged positions rather than long-term holders.
If the historical pattern holds, the current weak stretch could mark a major accumulation zone rather than the start of a deeper trend break. The article says similar setups in the past came before significant price appreciation.
The article itself says price could still go lower, and the move through $70,000 was sharper than the author expected. If the 200-week moving average and nearby cycle low fail to hold, the technical case for a rebound would weaken.